Too much data, too little screen
Coordinates, pitch maps, wagon wheels and dozens of stats all compete for one small phone screen.
A live cricket analytics app that gives fans a God's Eye View of the field: where every fielder stands, where every ball lands, and what the numbers really mean.
A scoreboard tells you what happened. Arena shows you where and why: a live field overview, layered with a line/length map, a wagon wheel and Arena Metrics that put every number in context.
“We approach sports analytics with a next-generational product, developed in an academically certified methodology, strategic alliances with main actors and an agile operation process.”
From the Arena brief
Ball-by-ball tracking produces far more data than a 375-pixel screen can show. The job was to turn coordinates, pitch maps and expected metrics into something a fan can read in a glance, mid-over.
Coordinates, pitch maps, wagon wheels and dozens of stats all compete for one small phone screen.
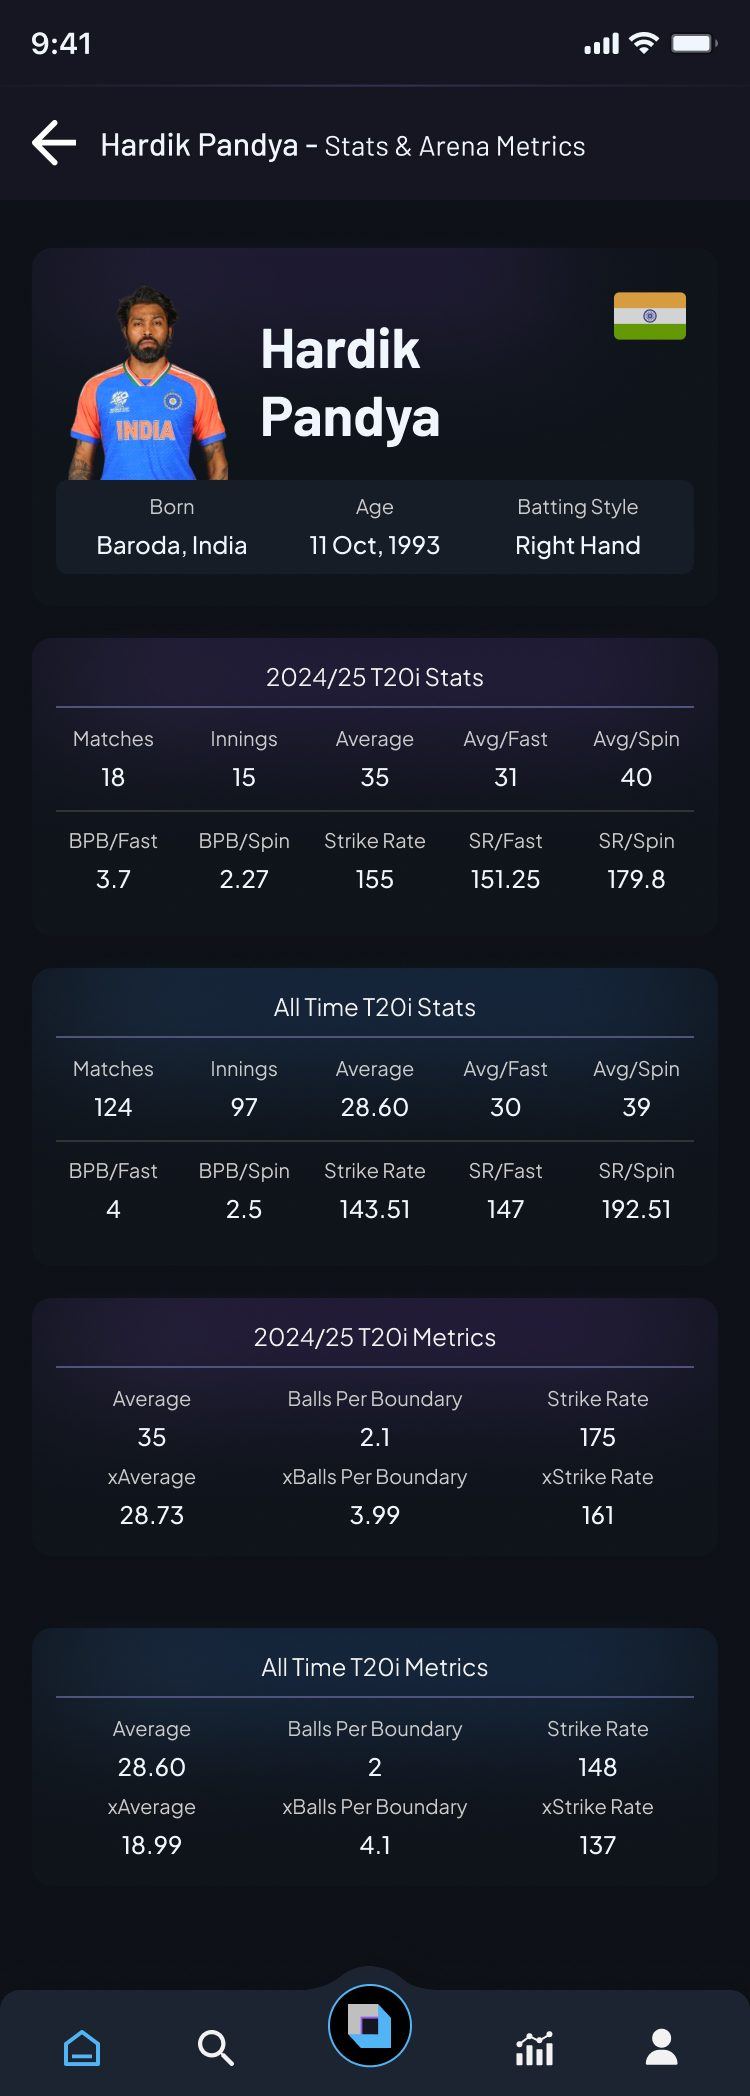
A strike rate of 175 means little on its own. Fans need to know if it is good for the balls a batter faced.
A T20 over lasts about four minutes. Anything that takes longer than a glance to read is already out of date.
Casual fans want the story of the match; businesses and analysts want the depth behind it.
A field overview is overlaid with a live line/length map and wagon wheel. Coupled with Arena Metrics, fans see the whole game from above. Switch the layers on and off.
The home screen reads top to bottom like the story of an innings. Hover the phone, or scroll inside it, to follow it.

Every stat sits next to its "x" twin, what a player was expected to do given the deliveries they faced. The gap is the story. Example from Hardik Pandya's player screen.
Lower balls-per-boundary is better
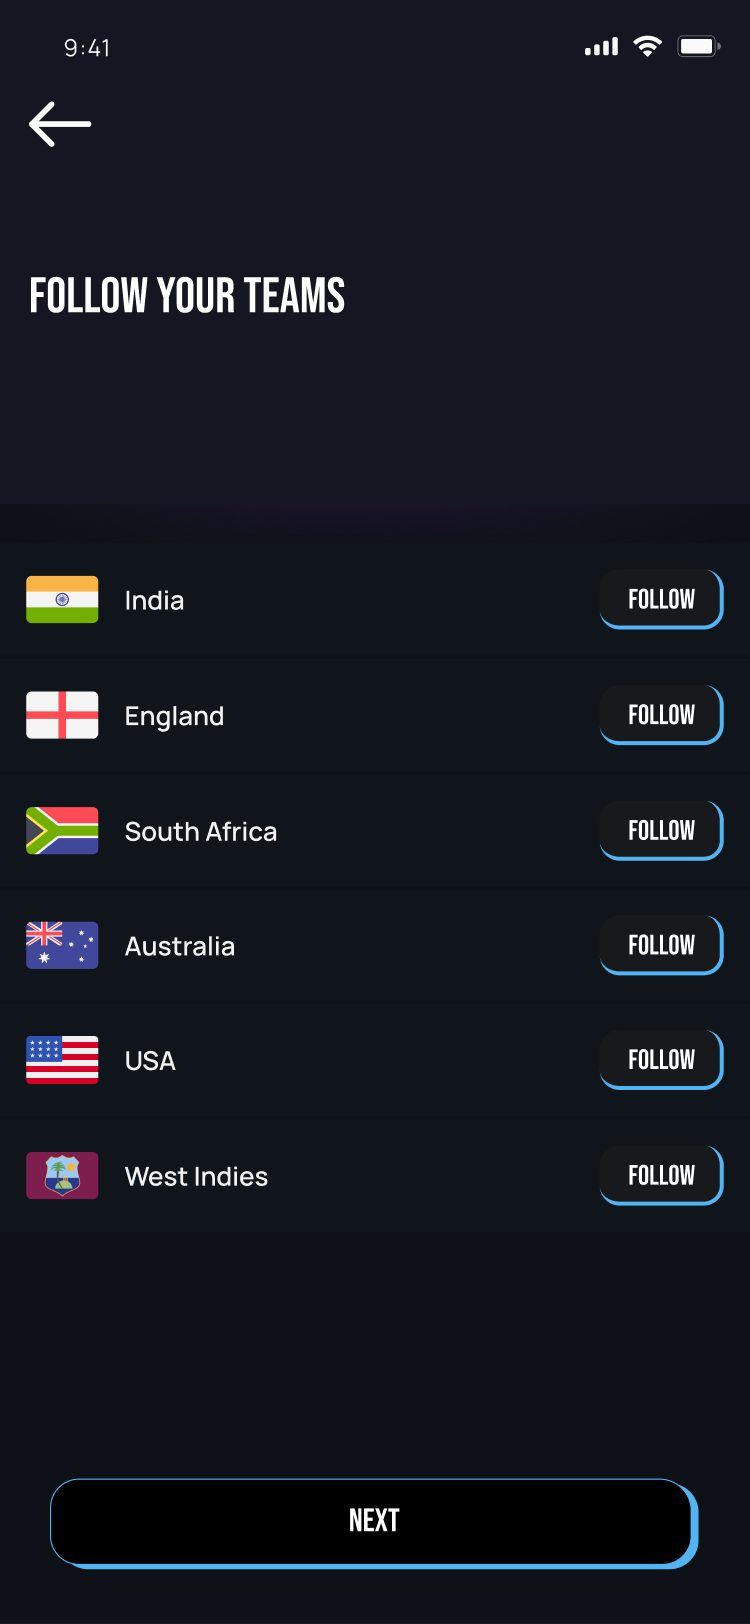
Onboarding asks only what it needs: which teams and players you follow. After that, every number on the home screen opens a focused detail view.
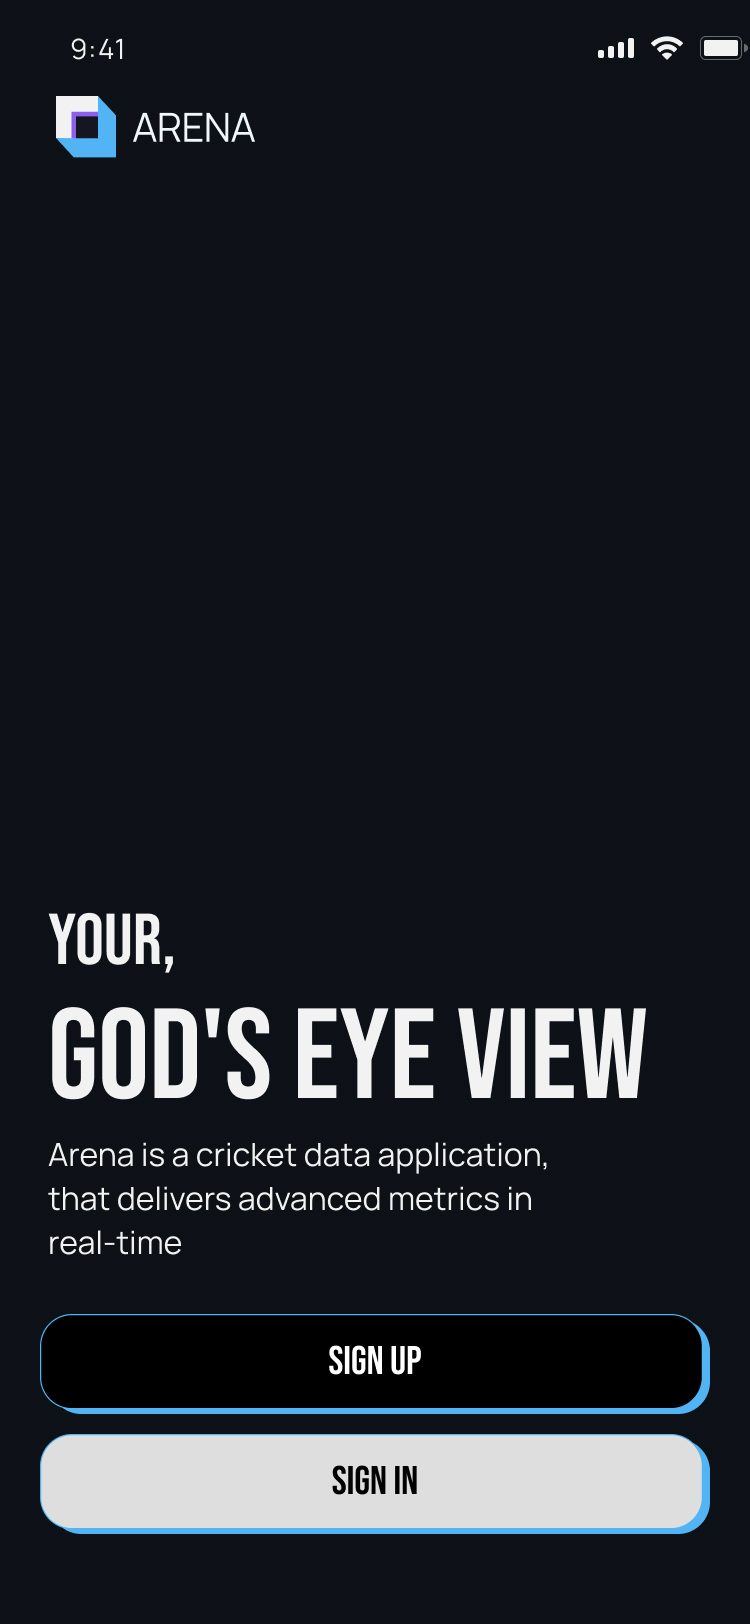
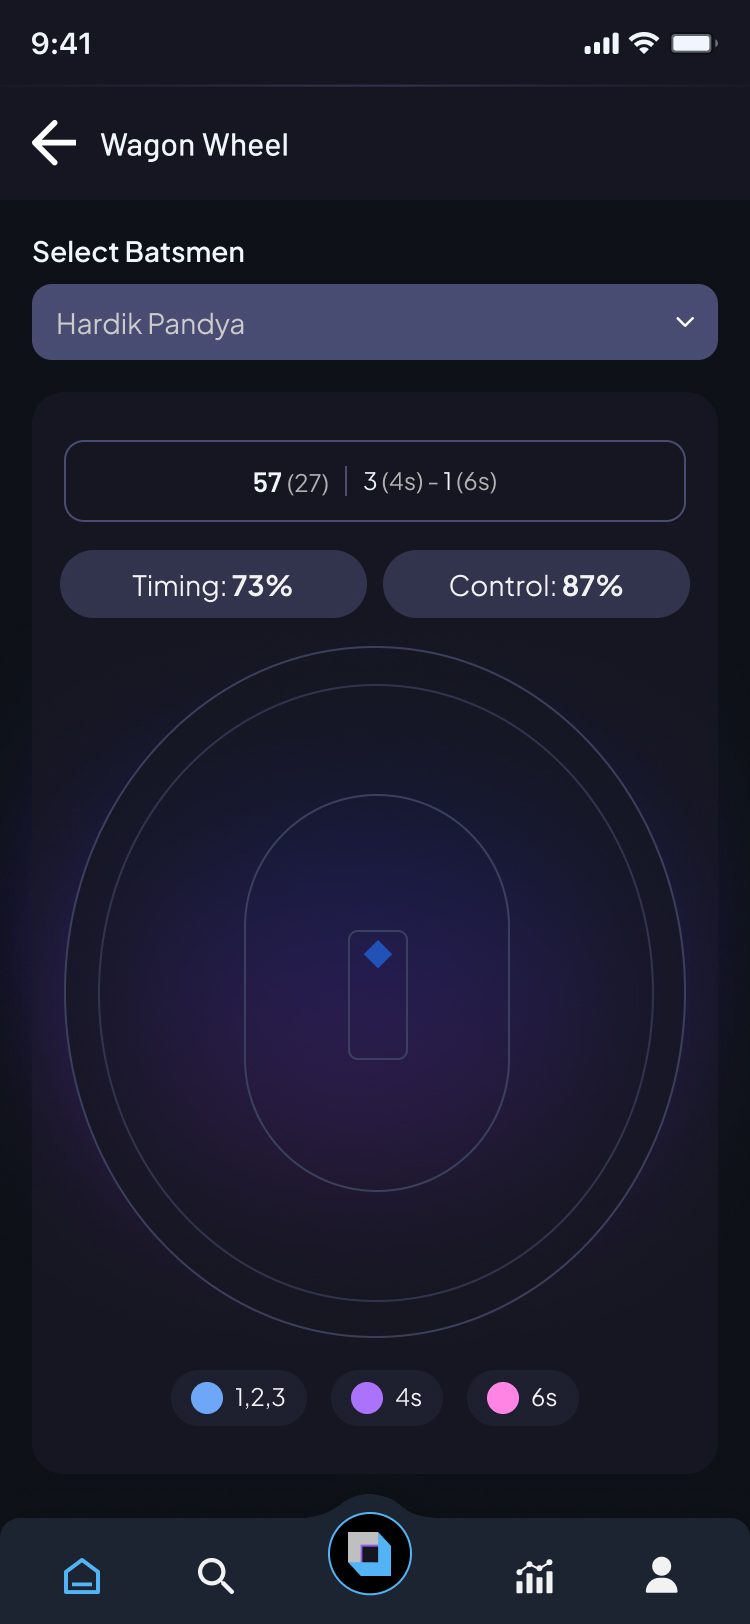
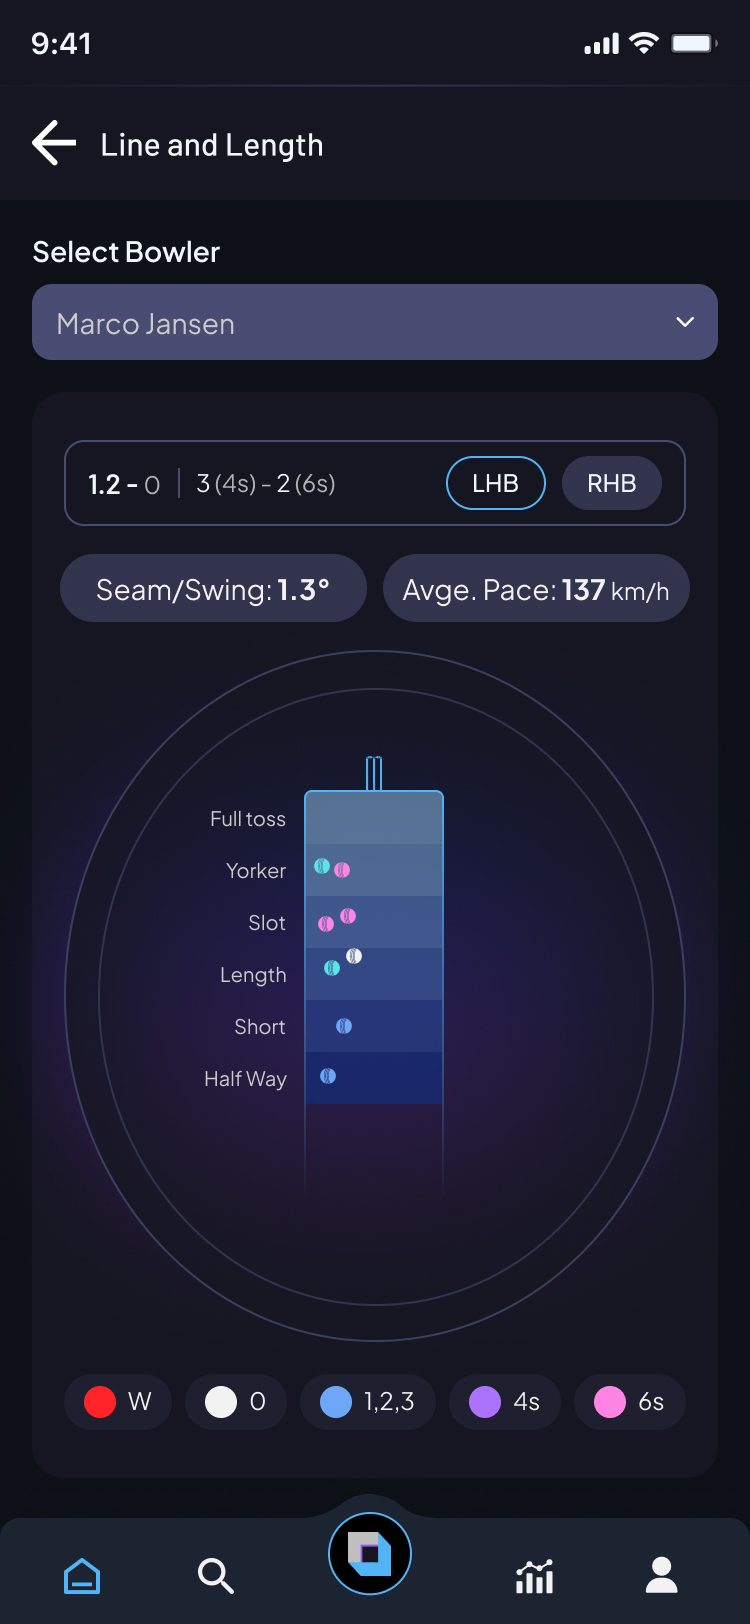
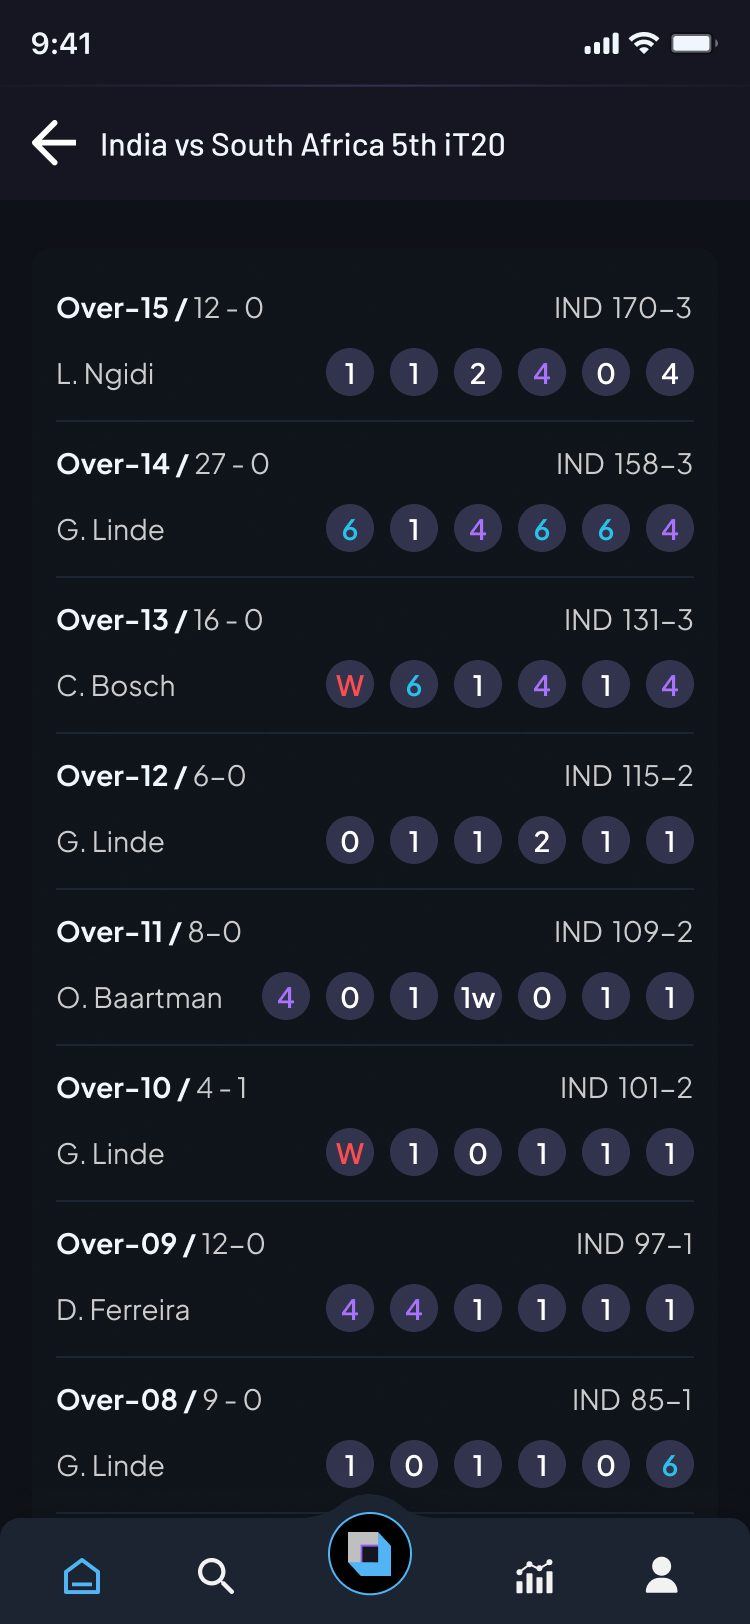
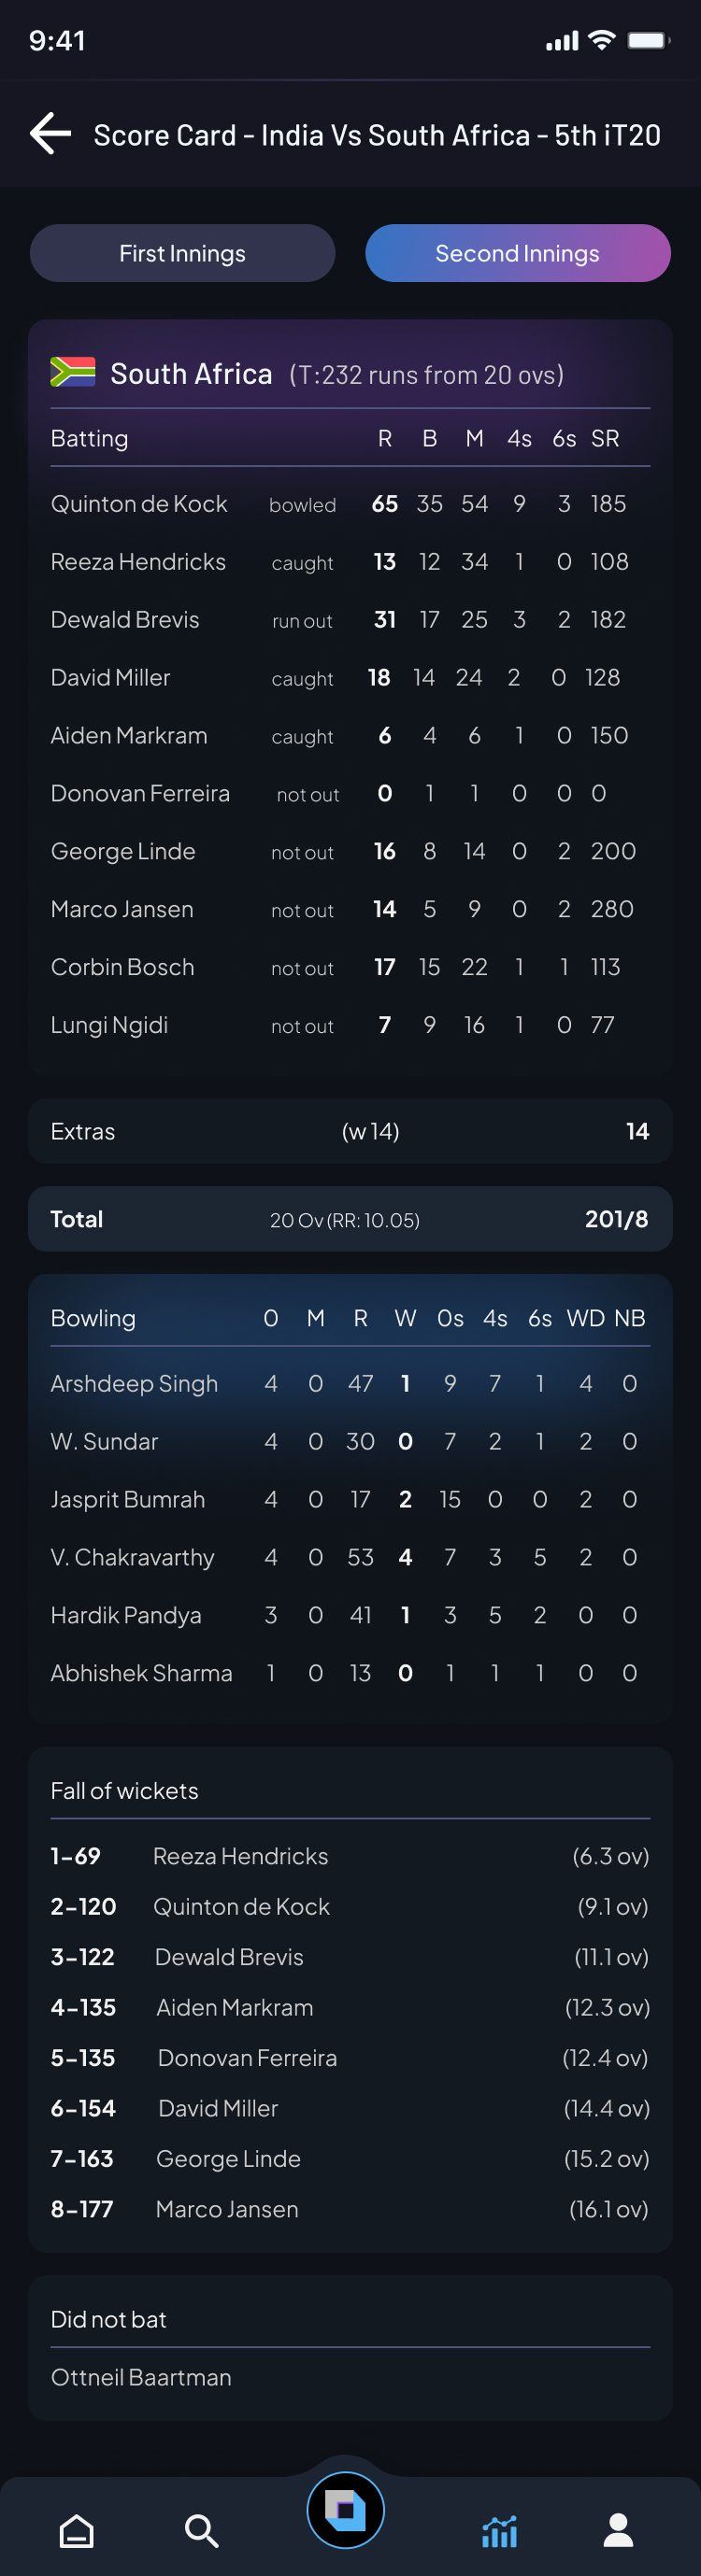
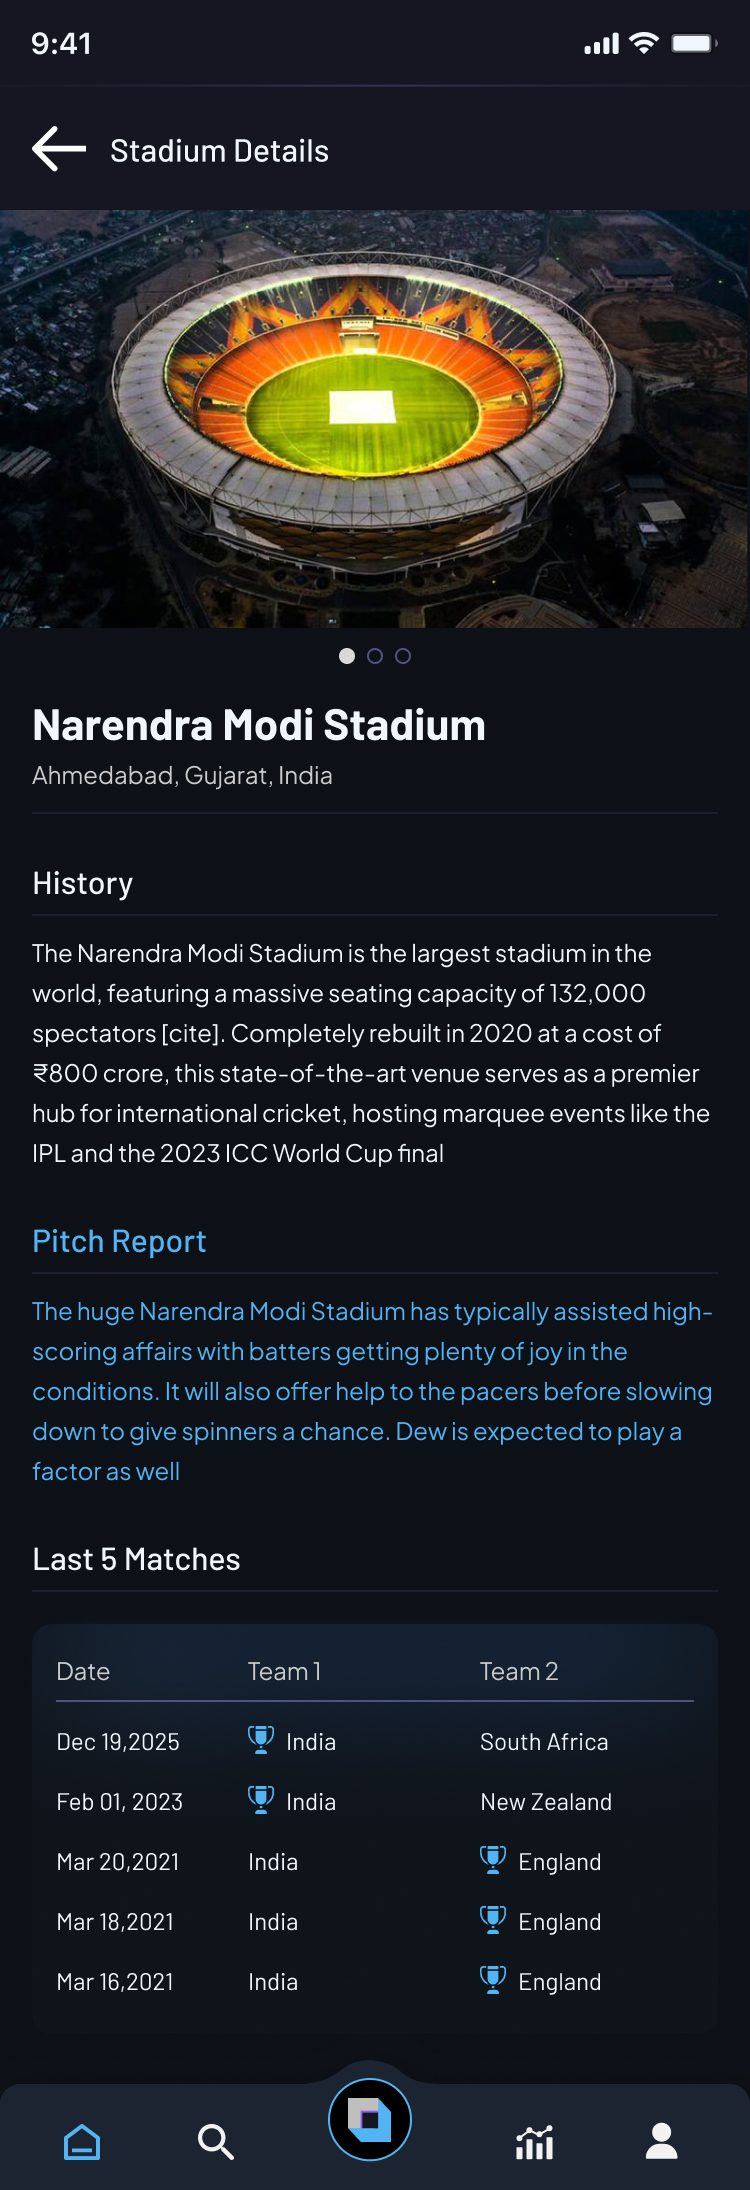
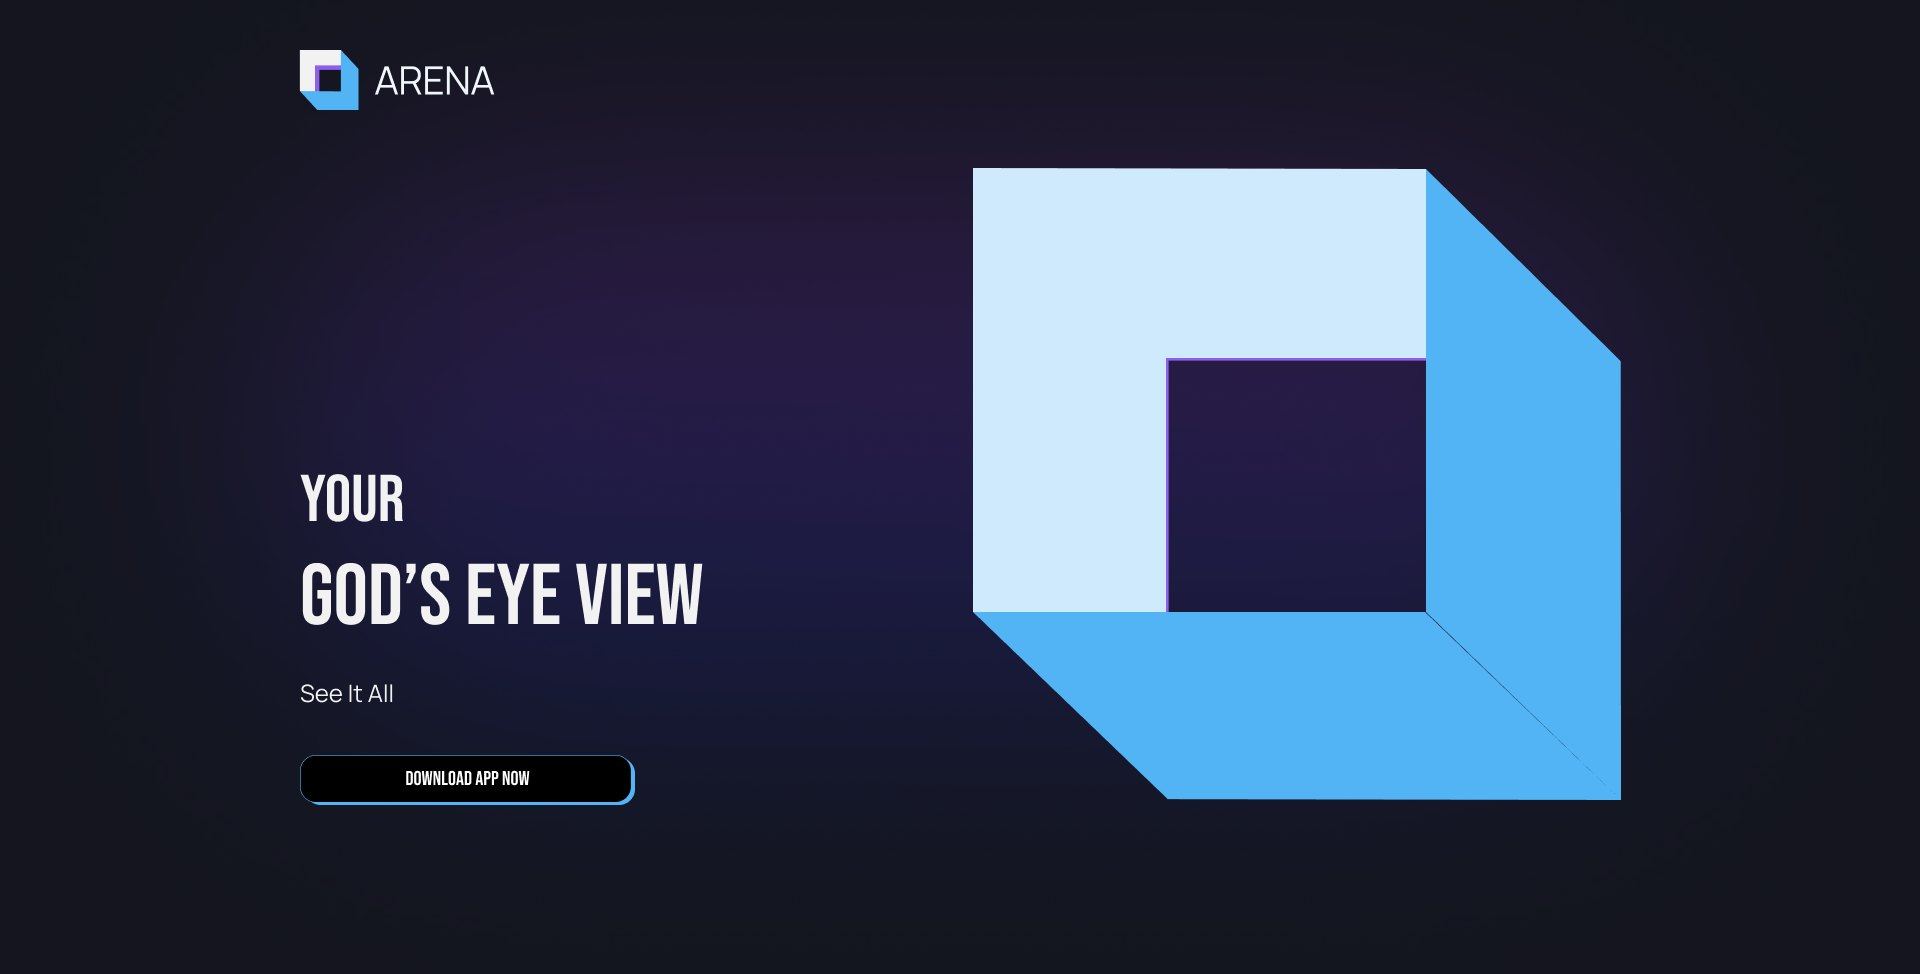
The landing page carries the app's language: the cube logo, condensed headlines and the four layers of God's Eye View, with a contact form that splits Business and Consumer leads.
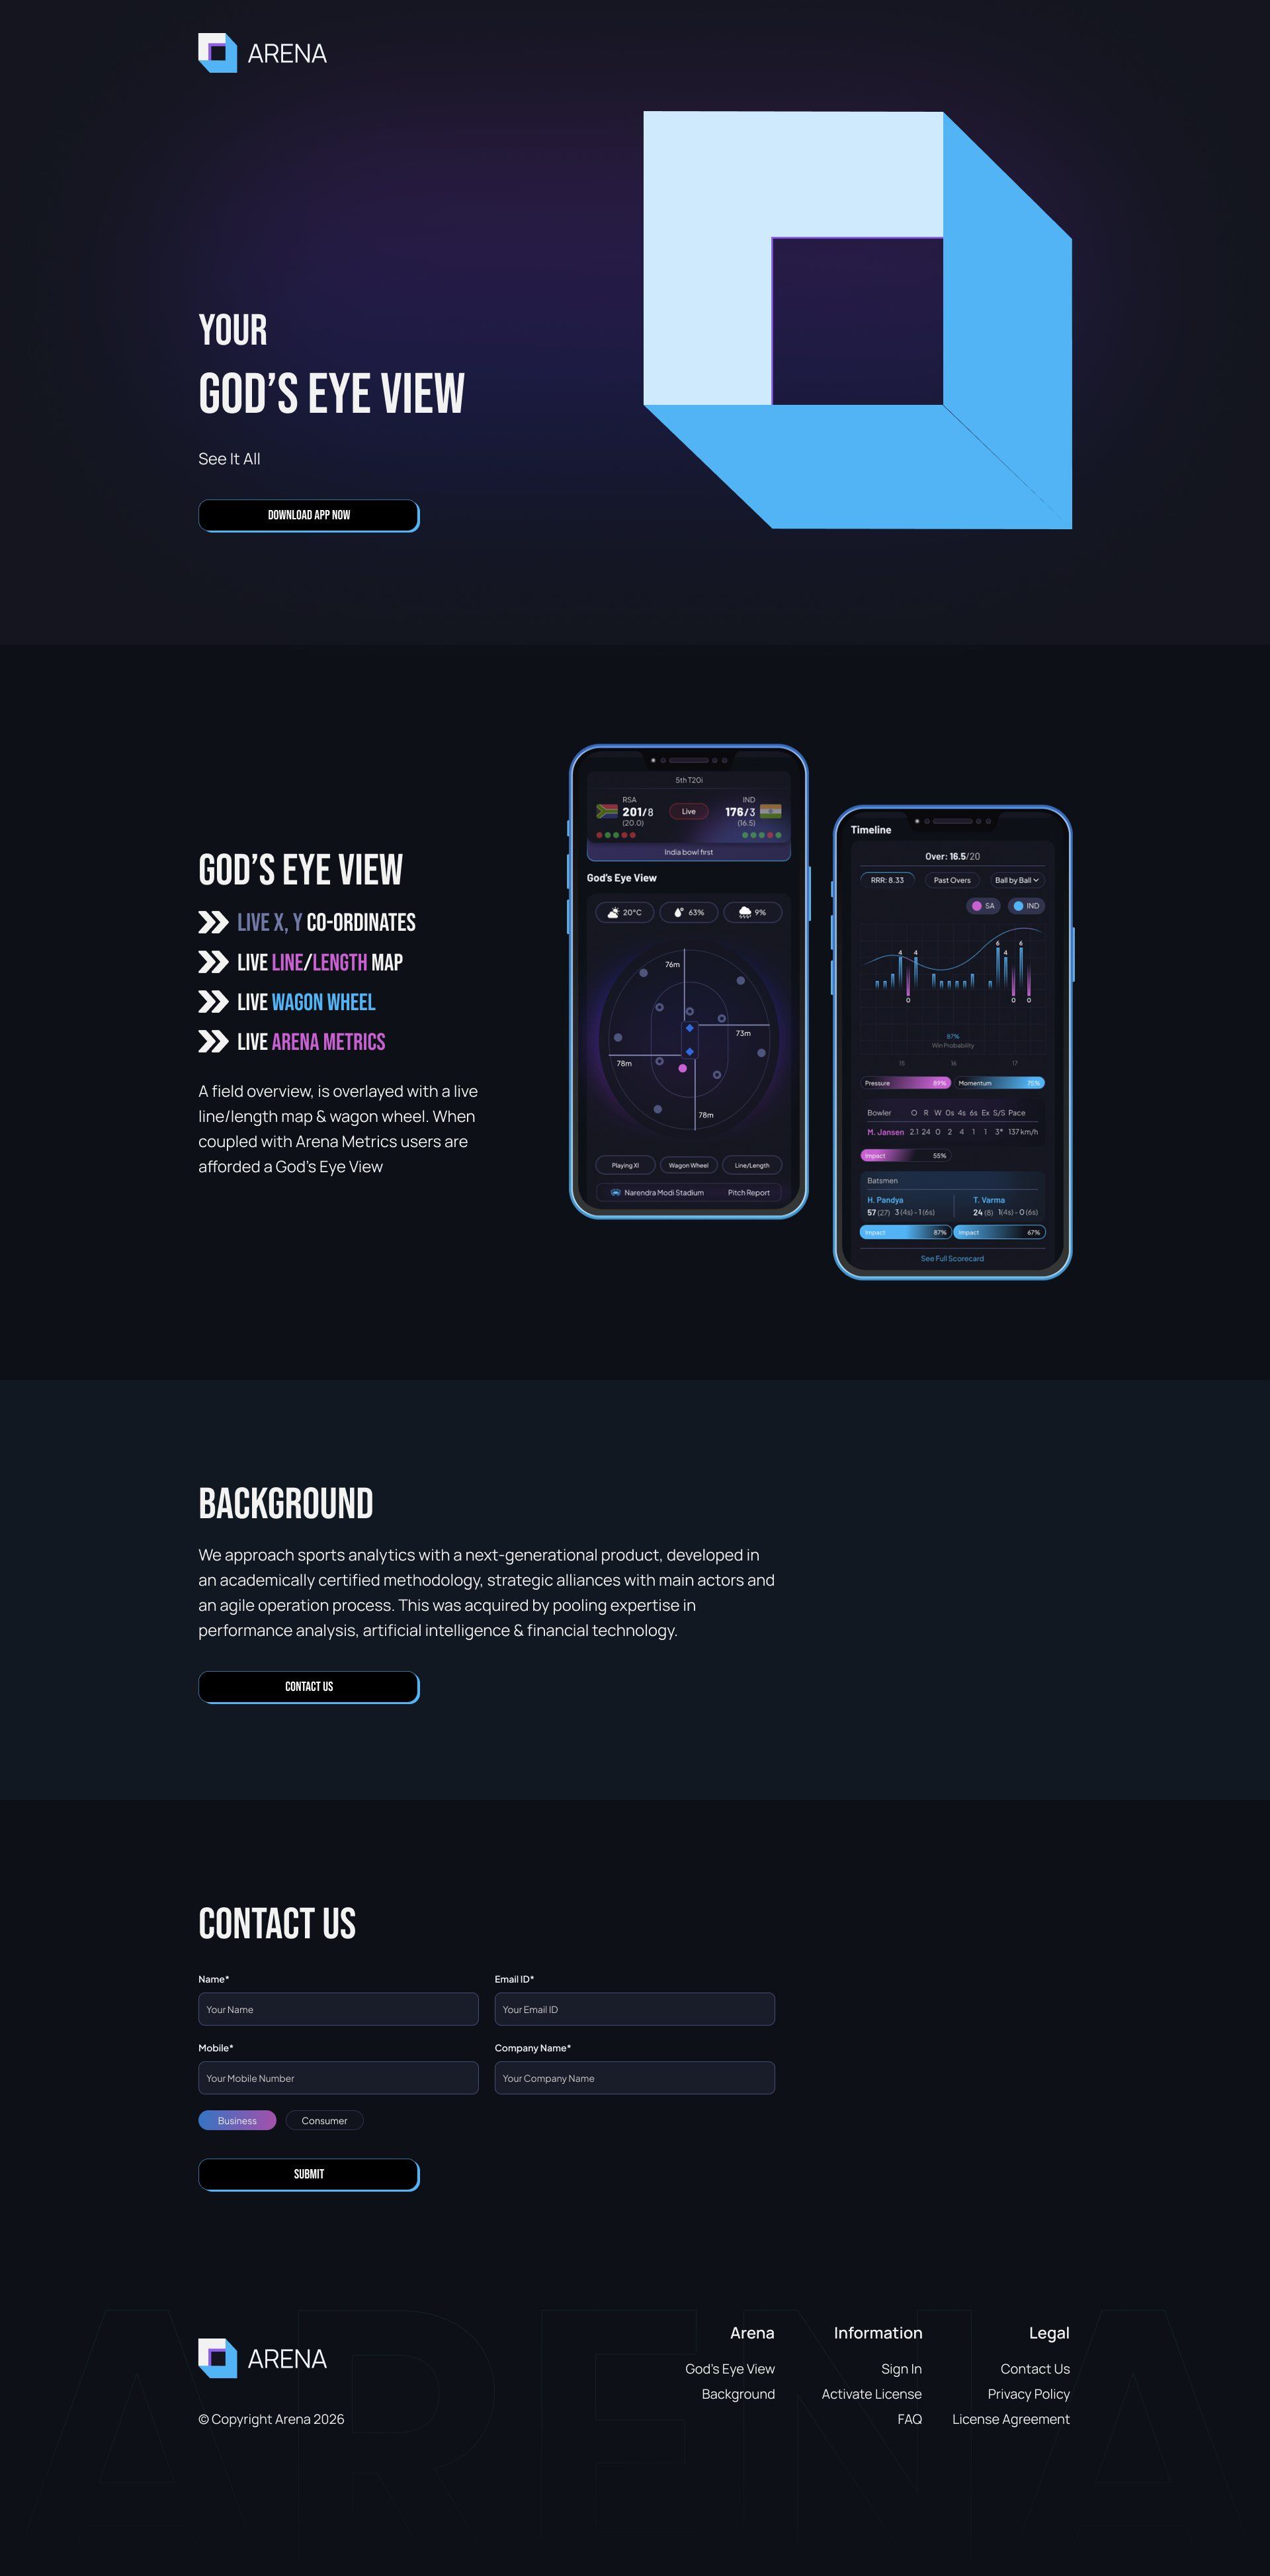
A deep navy base keeps the field and charts glowing. Blue, purple and pink carry runs, boundaries and sixes everywhere, from the wagon wheel to the impact bars.
Barlow for scores and names that must read at a glance, Plus Jakarta Sans for labels and dense stat tables, and a condensed display face for headlines.
Mobile app + website. The main pieces of the final design:
Building something similar? Tell me about it →